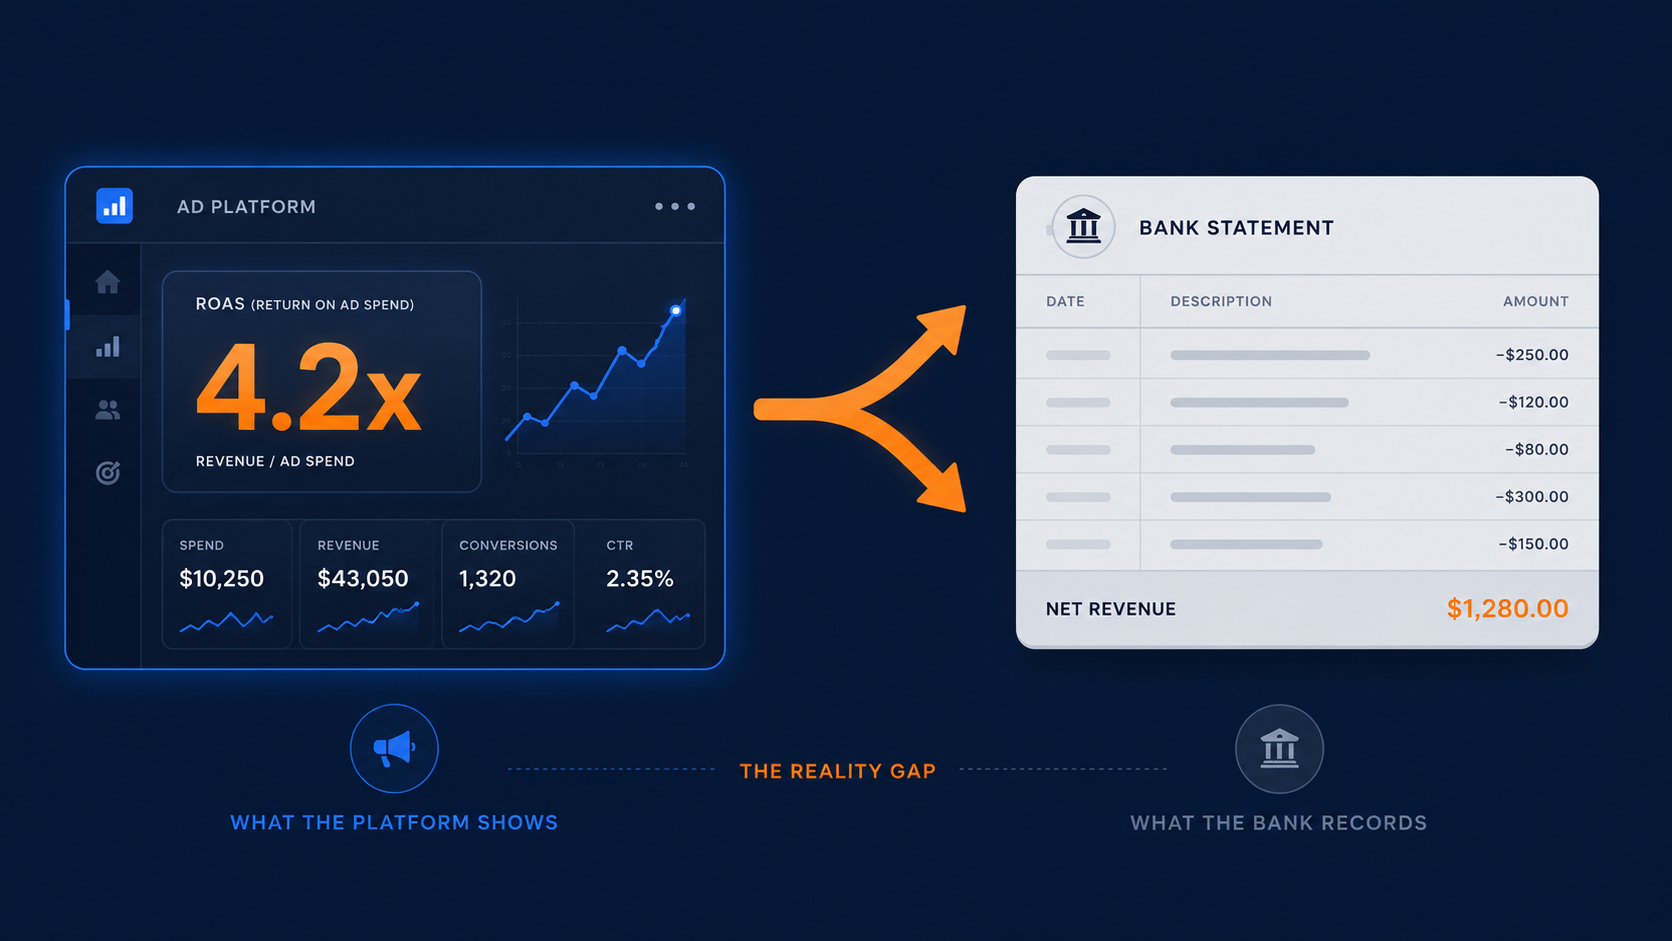

Platform ROAS is inaccurate by design, and it is not a setting you can fix in Ads Manager. Meta reports a 4.2x return. Google reports 3.8x. TikTok claims its share on top. Add the reported numbers up and your advertising looks like it tripled your money. Then you open the bank statement and the growth is not there.
That gap is the whole story behind blended ROAS vs platform ROAS. Platform ROAS measures what a single channel can attribute to itself. Blended ROAS, and its close relative the Media Efficiency Ratio (MER), measures what your entire business actually earned for every pound you put into marketing. One number is a sales pitch written by the platform. The other is the truth your profit and loss statement already knows.
Here is the short version before the detail. If you make one measurement change this quarter, calculate your MER every week and judge it against your gross margin, not against a channel's self-reported return. The rest of this piece gives you the formula, the benchmark logic, and a worked example you can copy — and if you'd rather have us run the reconciliation for you, that's exactly what our free Data Audit Checklist walks you through first.
PART 01What platform ROAS actually measures
Platform ROAS is the revenue a channel claims, divided by the spend on that channel. The problem sits in the word "claims".
Every ad platform is scoring its own exam. Meta decides which orders Meta is allowed to count. Google decides the same for Google. Neither one can see the other, and neither one has any incentive to hand credit away. So when a customer sees a Meta ad on Monday, clicks a Google Search ad on Wednesday and buys on Thursday, both platforms can book the same order. You paid for one sale. Your dashboards report two.
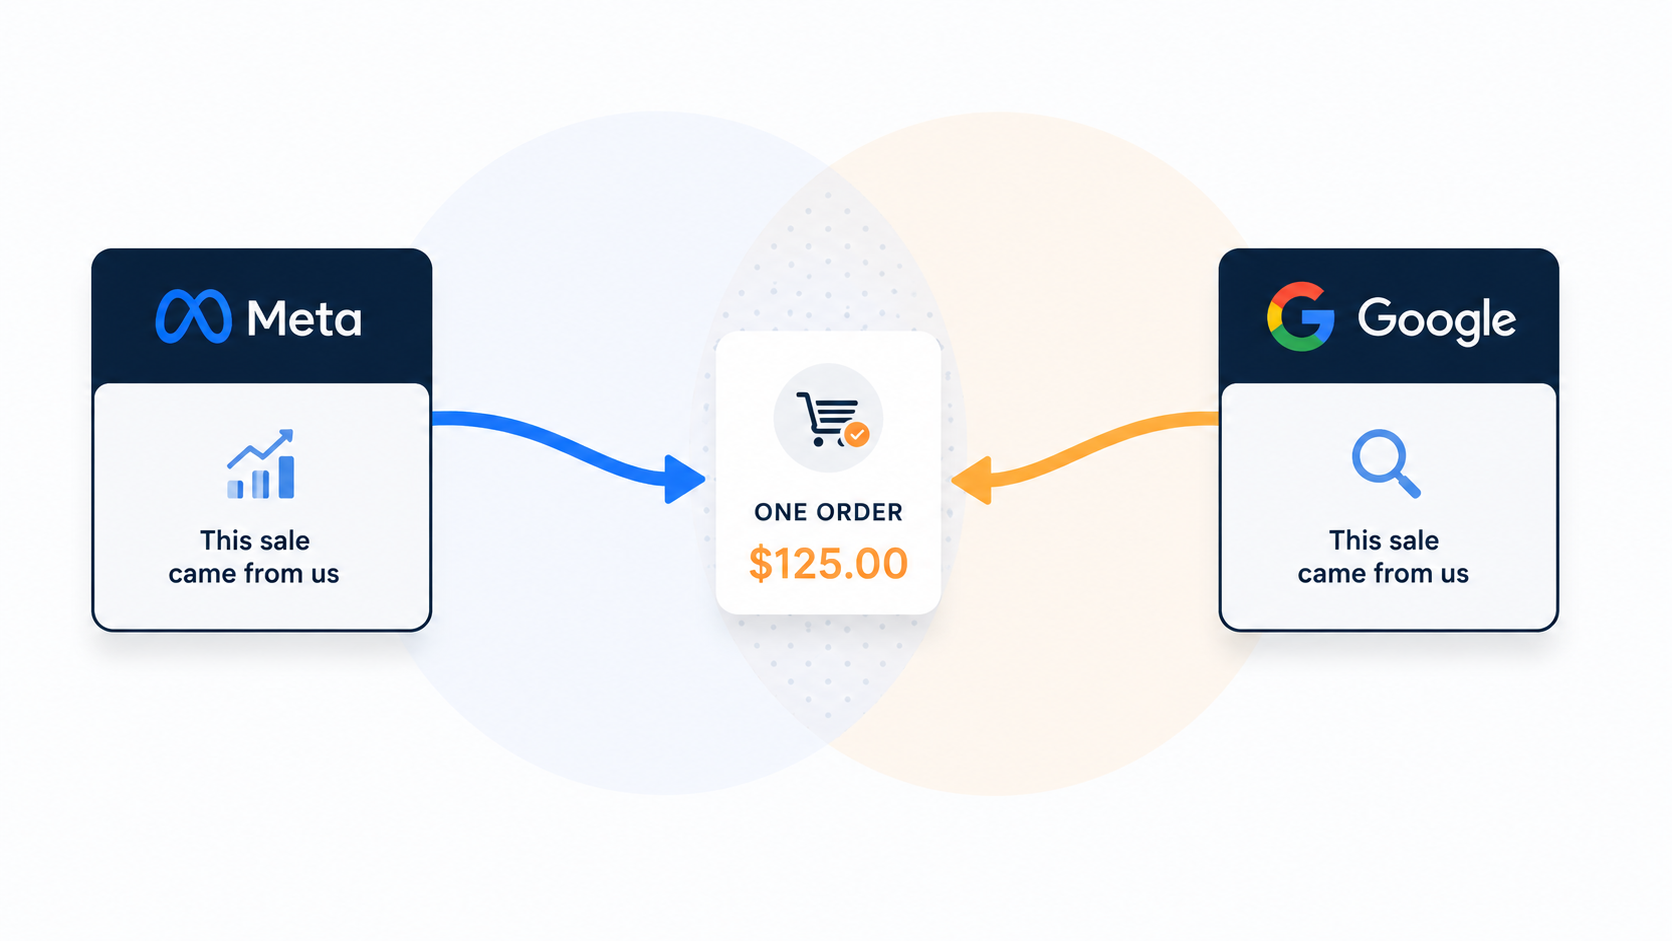
This is why the sum of your channel returns almost never matches reality. Channel-level ROAS was built to optimise a single channel, and it does that job well. It was never built to tell you whether your marketing as a whole makes money.
PART 02The self-reporting problem: four reasons the numbers never add up
Platform-reported ROAS runs higher than your real return for four predictable reasons. Understanding them is the difference between arguing with your agency and fixing the measurement.
- Attribution overlap. When several channels run at once, the same order gets claimed more than once. The more channels you add, the wider this gap grows.
- View-through counting. Meta can attribute a conversion to someone who saw an ad and never clicked it. Google Analytics has no equivalent for Meta view-through, which is one of the largest single sources of divergence between the two platforms.
- Self-attribution bias. The platform writes the rules for what it is allowed to count, then counts generously. No scorekeeper marks its own work down.
- Modelled conversions. Where tracking signal is missing, platforms estimate the conversions they think happened and add them to the reported figure. Estimated revenue spends nothing at the till.
The practical consequence is simple. You cannot reconcile these numbers inside any single platform, because no platform can see the double counting it is part of. The only honest view comes from putting real revenue and real spend in one place, outside the platforms entirely — which is exactly what a clean data foundation is for.
PART 03Attribution windows, and what changed in 2026
An attribution window is the length of time after a click or a view during which a platform is allowed to claim the sale. It is a dial, and the platform sets the default in its own favour.
Meta's default is 7-day click plus 1-day view. A wider window claims more conversions, which feeds Meta's algorithm more signal and produces a more flattering return in your dashboard. Both effects are real, and both benefit the platform.
Two changes in 2026 are worth knowing, because they moved the numbers under people's feet. In January 2026 Meta removed the 7-day view and 28-day view options, so the longest view-through window is now a single day. In March 2026 Meta redefined a click-through conversion to require an actual link click, moving likes, shares and saves into a separate "engage-through" bucket with a one-day window. If your reported conversions shifted this spring and nobody changed a campaign, this is why. The reporting definition changed, not your performance.
The takeaway is not to memorise the windows. It is to accept that the platform controls the ruler, changes it when it likes, and always leans towards claiming more.
PART 04The iOS 14.5 effect: why this got structurally worse in 2021
None of this is new, but it sharpened in 2021. Apple's App Tracking Transparency launched with iOS 14.5 on 26 April 2021 and required apps to ask permission before tracking users across other apps and sites. A large share of users declined.
Once a meaningful slice of users became invisible to the pixel, platforms could no longer measure many conversions directly. They filled the hole with modelling. Modelled conversions are estimates, and estimates on a platform's own scorecard tend to be optimistic. The self-reported number drifted further from the bank balance, and it has stayed there.
This is the environment your reporting lives in now. Signal loss is permanent, modelling is baked in, and the platforms still mark their own homework. That is precisely why you need a number they cannot touch.
PART 05The Media Efficiency Ratio (MER): the number they cannot inflate
MER is the number that sits above every platform and cannot be padded by any of them. It divides all of your revenue by all of your marketing spend, in one currency, over one time period.
MER = Total revenue / Total marketing spend
No windows. No view-through. No modelling. If you did £500,000 in revenue on £125,000 of total marketing spend, your MER is 4.0. That is the whole calculation, and its refusal to be clever is the point.
It helps to separate three numbers that the market constantly blurs together, so a quick true ROAS calculation comparison earns its place here.
| Metric | Formula | What it answers | Where it belongs |
|---|---|---|---|
| Channel (platform) ROAS | Channel-claimed revenue / channel spend | Which ad set or creative to scale or cut | Inside a single platform |
| Blended ROAS | Total revenue from paid / total paid media spend | Is my paid media as a whole efficient | Across all paid channels |
| MER | Total revenue / total marketing spend | Is marketing making the business more profitable | The whole business, P&L level |
Blended ROAS and MER differ only in the denominator. Blended ROAS looks at paid media alone. MER usually includes everything with "marketing" on the invoice: paid media, agency fees, email and SMS platforms, influencer costs. Decide once which costs you include, write it down, and never quietly change it, because a moving denominator is how a ratio starts lying to you.
PART 06How to calculate MER, step by step
- Pull total revenue for the period from your store back end, not from any ad platform. Your Shopify admin is the ground truth.
- Add up total marketing spend for the exact same period, across every channel, in one currency.
- Divide revenue by spend. That is your MER.
- Repeat weekly and plot the trend. A single MER reading is noise. The direction of travel is the signal.
PART 07What a good MER actually is: the benchmark nobody sources
Search "good ROAS" and you will be told 4:1. That figure is repeated everywhere and anchored to nothing. A 4x return is comfortable at a 70% gross margin and a fast route to bankruptcy at 25%. Any benchmark quoted without asking your margin is a guess wearing a suit.
Your real target is not borrowed from a blog. It comes from your own economics, and the maths is short.
Breakeven MER = 1 / gross margin
At a 50% gross margin, your breakeven MER is 1 / 0.50, which is 2.0. Below 2.0 you are paying to lose money. At a 33% gross margin, breakeven is 1 / 0.33, roughly 3.0. Same business model, very different floor, and the "4:1 rule" would have told both brands the same useless thing.
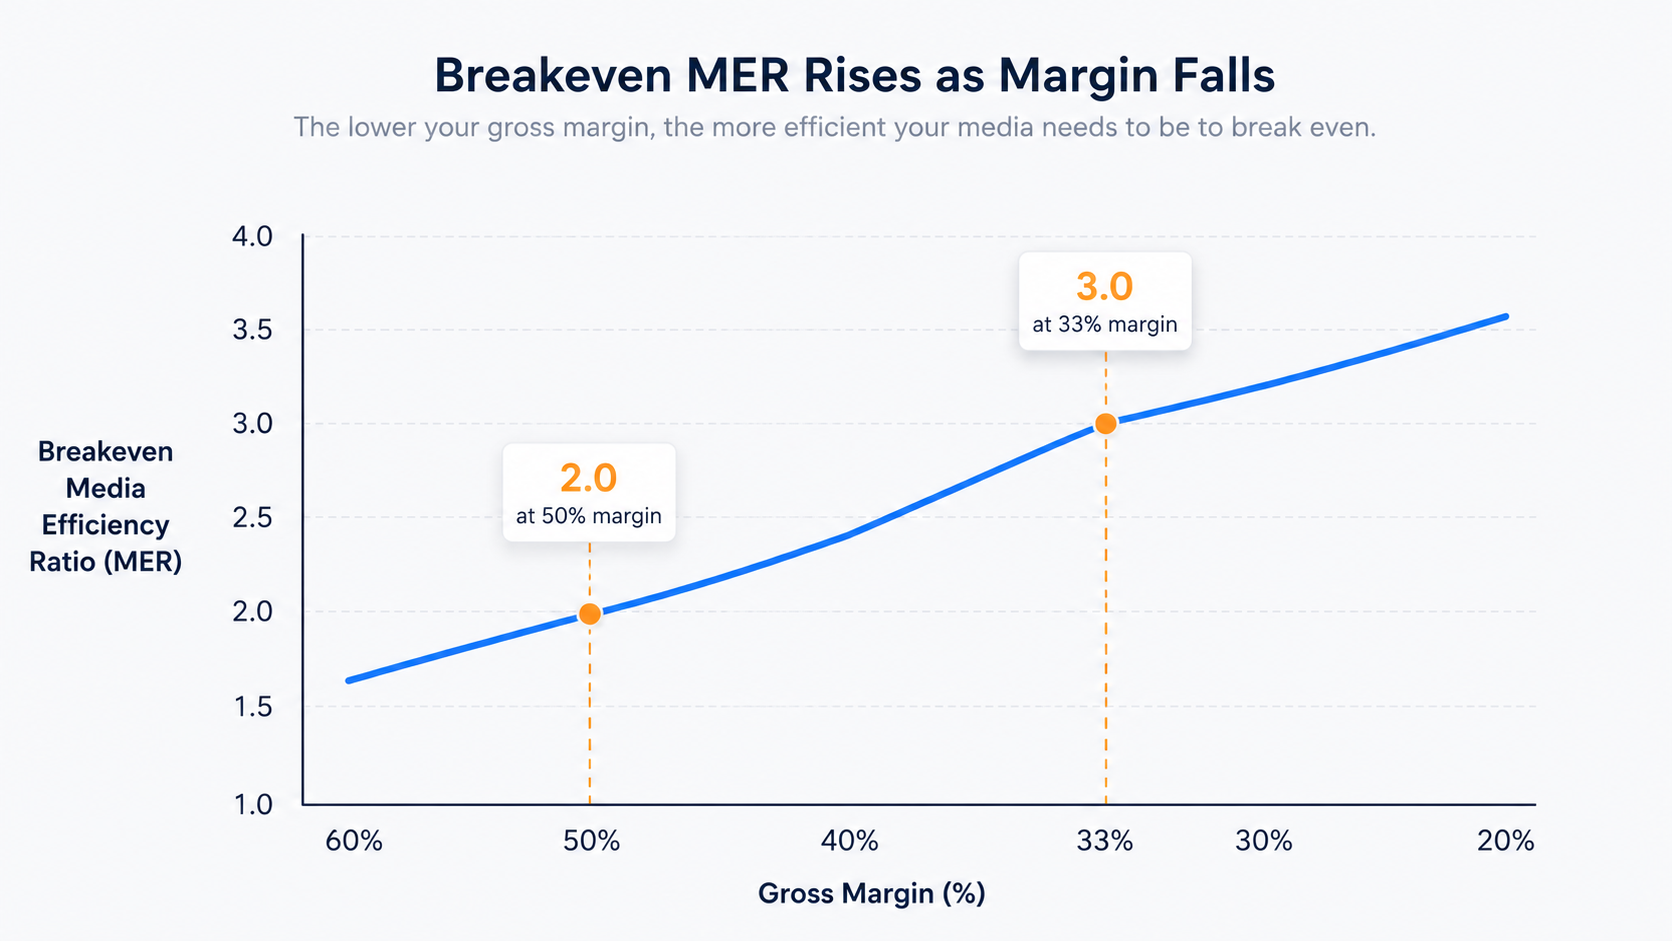
Your target MER then sits above breakeven by enough to cover fixed costs and leave the profit you actually want. A MER benchmark worth trusting is one you derived from your gross margin and your overheads, not one you found on the internet. Category figures vary far too widely to publish as fact. Where you see them here or anywhere else, treat them as estimated ranges (est.) and check them against your own margin before you act.
PART 08The weekly rhythm: how to operate with both numbers
The mistake is treating this as either/or. Channel ROAS and MER answer different questions, and a healthy operator uses both on a set cadence.
- Daily, inside each platform: use channel ROAS to make within-channel decisions. Which creative is fatiguing, which ad set to scale, which to switch off. This is the only job channel ROAS is fit for.
- Weekly, across the business: calculate MER and blended ROAS from your reconciled revenue and spend. Compare MER against your margin-derived floor. This is the number you report and the one you plan against — the same reconciliation problem we cover in why your dashboard isn't making you money.
- When they disagree: trust the blend. If Meta says 6.0x, Google says 4.2x and your blend is 2.9x, the blend is the honest figure. Your ads did not suddenly get worse. You simply stopped counting the same order three times.
One warning. Never use the blend to decide which channel to cut, because the blend cannot see individual channels. If you kill a channel the blend gives no credit to, your total revenue can quietly fall while your MER looks unchanged. Blended numbers judge the whole. Channel numbers allocate the parts. Keep the two jobs separate.
Download the free checklist
The E-commerce Data Audit Checklist walks through the exact places revenue and spend drift apart across systems. Three pages, free, no email gate.
→ Get the checklistBook a 20-minute audit call
We will look at where your platform returns and your bank balance diverge, and which numbers you can actually trust. No pitch if it doesn't apply.
→ Book a callPART 09A worked example
Here is the pattern, using illustrative figures with stated assumptions rather than industry benchmarks. Assume a DTC brand at a 55% gross margin, running Meta and Google in one month — the same kind of blended-channel picture we untangle in 5 Revenue Leaks in Your E-commerce Data.
- Meta reports 4.2x on £60,000 spend, claiming £252,000.
- Google reports 3.6x on £40,000 spend, claiming £144,000.
- Summed platform revenue: £396,000 on £100,000 spend, an apparent 3.96x.
- Actual total revenue from the store: £290,000.
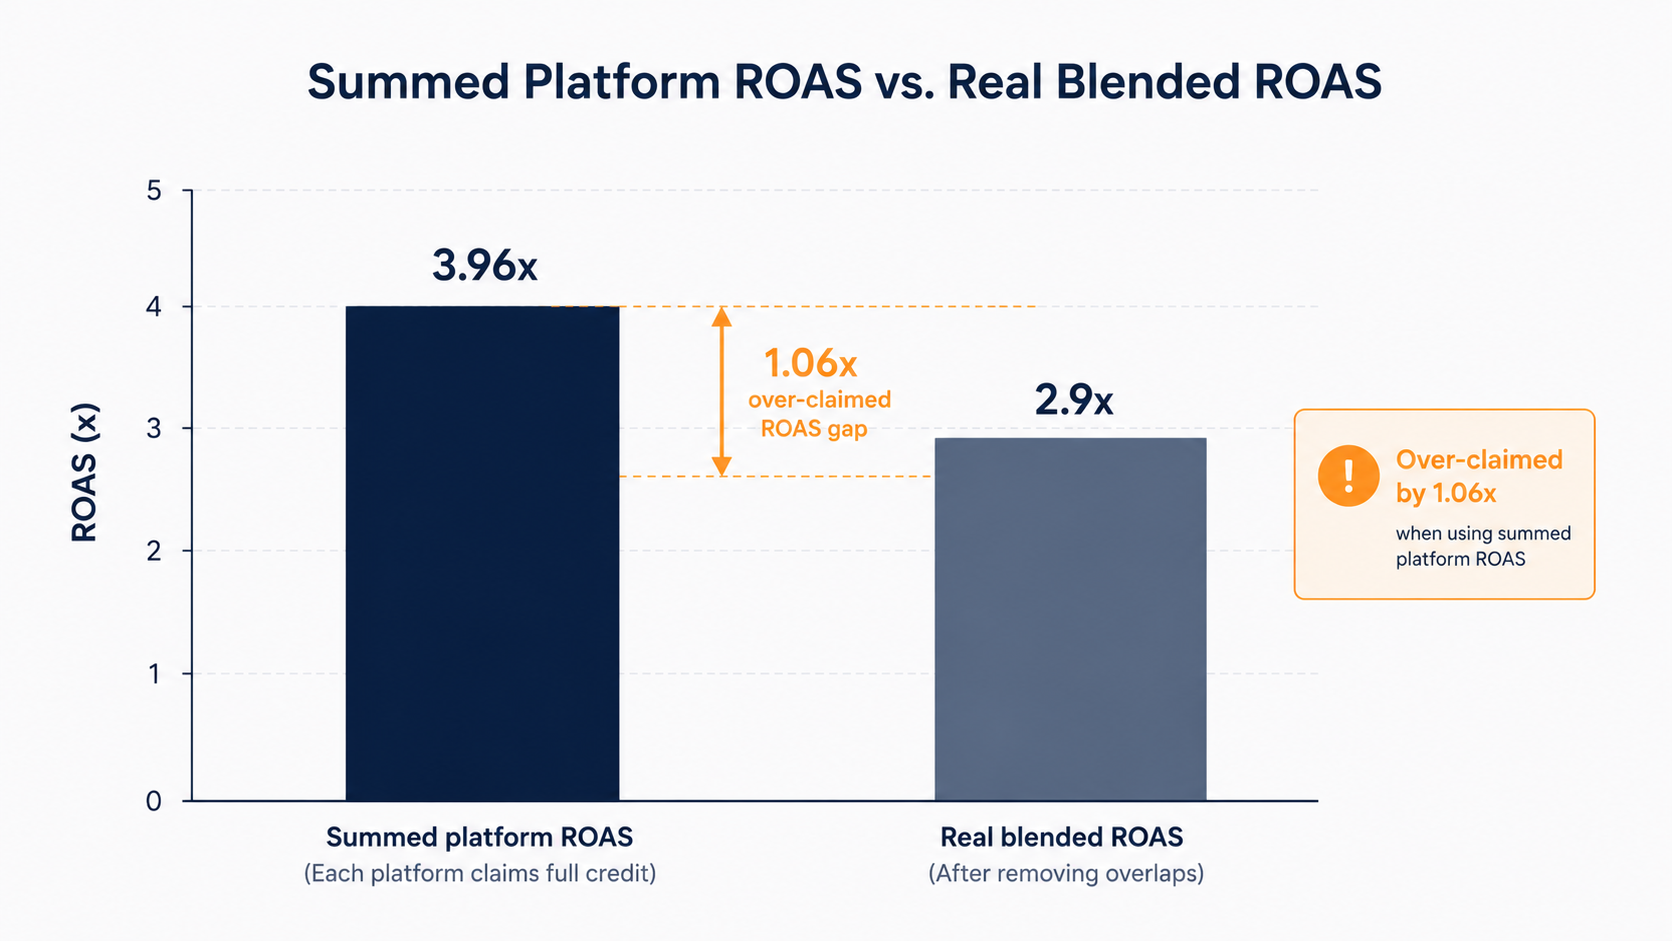
Real blended ROAS is £290,000 / £100,000, which is 2.9x, not 3.96x. The platforms over-claimed by more than a third, entirely through overlap and view-through. Now apply the margin test. Breakeven MER at 55% margin is 1 / 0.55, roughly 1.8x. At 2.9x this brand is comfortably profitable, which the panic over "declining ROAS" would never have told them. The reported numbers were both too high and pointed at the wrong worry.
The figures above are dataset parameters chosen to show the mechanism. Your gap will be larger or smaller depending on how much your channels overlap, but the shape is almost always the same: the sum of the parts overstates the whole.
PART 10nMER: the version that governs acquisition
There is one more number worth building, and it is the one that should drive your scaling decisions. New customer MER, or nMER, divides new customer revenue by total marketing spend.
Total MER flatters you when your returning customers are strong, because loyal repeat buyers make your marketing look efficient even when acquisition is struggling. nMER strips that out. It asks the harder question: is my marketing spend actually buying new customers profitably, or is it coasting on the base I already built? For any brand trying to grow rather than simply hold, nMER is the truer efficiency number, and it is the one that stops you scaling spend into a channel that only ever re-sells to people you already had.
PART 11Frequently asked questions
What is the difference between blended ROAS and platform ROAS?
Platform ROAS is the revenue a single channel claims divided by that channel's spend, and it can be inflated by attribution overlap, view-through counting and modelling. Blended ROAS divides your total revenue by your total paid media spend, so no single channel can over-credit itself.
How do you calculate MER?
Divide total revenue by total marketing spend over the same period. If you earned £400,000 on £100,000 of total marketing spend, your MER is 4.0. Use total marketing spend, including agency and platform fees, not paid media alone.
What is a good MER for an ecommerce brand?
There is no universal figure. Your breakeven MER is 1 divided by your gross margin, so a 50% margin brand breaks even at 2.0 and needs to sit above that to cover fixed costs and profit. Any benchmark quoted without reference to your margin is unreliable.
Why is platform ROAS higher than my real return?
Because each platform counts conversions it may have only partly influenced, adds view-through conversions with no cross-platform equivalent, and fills tracking gaps with modelled estimates. Summed across channels, the same orders get counted more than once.
PART 12The bottom line
Platform ROAS is not useless. It is just answering a smaller question than the one you are asking. Use it to run individual channels. Use MER, judged against your own gross margin, to run the business.
If your platform returns and your bank balance tell different stories and you cannot see where the gap opens up, the answer almost always lives in how several systems record the same revenue and spend differently. That is exactly the problem BAP Data untangles. Book a free 20-minute audit call and we will look at where your numbers diverge and which of them you can actually trust.
Sources. Apple App Tracking Transparency, iOS 14.5, launched 26 April 2021 (Apple; corroborated by Macworld and MacRumors). Meta default attribution window of 7-day click plus 1-day view; 7-day and 28-day view options removed 12 January 2026; click-through redefined to require a link click in March 2026, with likes, shares and saves moved to a separate engage-through bucket (Meta for Developers announcements; corroborated by Jon Loomer Digital and TheOptimizer, 2026). View-through has no GA4 equivalent, a major source of Meta-to-GA4 divergence (platform attribution documentation; corroborated by TheOptimizer, 2026). Breakeven MER = 1 / gross margin is arithmetic, not a sourced benchmark. Category MER figures are deliberately omitted; the worked example uses stated dataset parameters, not industry benchmarks.